Using the Surveillance, Epidemiology and End Results registry (2001-2014), we identified patients with ccmRCC and nonccmRCC. The authors relied on propensity score (PS) matching to reduce the effect of inherent differences between African-American vs. Caucasian patients. After PS matching that included access to cytoreductive nephrectomy, cumulative incidence, competing-risks regression (CRR) models and landmark analyses tested the effect of race on CSM.
Before PS matching, African-American patients accounted for 7.0 and 24.5% of ccmRCC (N=6742) and non-ccmRCC patients (N=766), respectively. After PS matching, African-American patients accounted for 22.3% and 33.5% of ccmRCC (N=2050) and non-ccmRCC (N= 391), respectively of the matched cohorts (See Figure 1). In multivariable CRR models focusing on ccmRCC, worse CSM was recorded in African-Americans (HR:1.27, p<0.001) Conversely, in non-ccmRCC, better CSM was recorded in African-Americans (HR:0.54, p<0.001) (See figure 2). Kaplan Meier curves demonstrate the better CSM African-Americans have in non-ccmRCC and the worse outcomes in ccmRCC (Figure 3).
The authors concluded that African-Americans have worse CSM in ccmRCC. Conversely, African-Americans experienced better CSM, when diagnosed with non-ccmRCC. These differences are independent of access to CN and warrant further study since they may have an impact on efficacy or access to systemic therapies.
Figure 1 – Before and after propensity score matching:
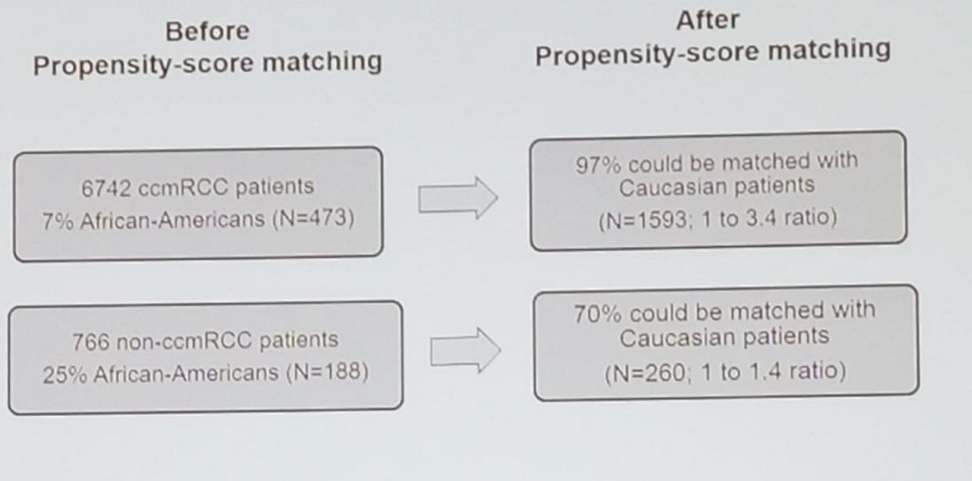
Figure 2 – Multivariable competing risk analyses predicting cancer specific mortality:
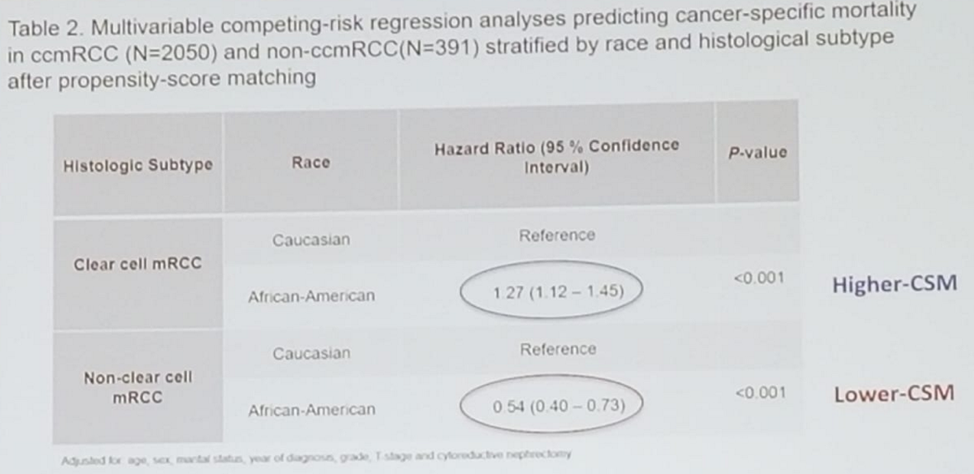
Figure 3 – Kaplan-Meier curves demonstrating Cancer specific mortality:

Presented by: Michele Marchioni, Chieti, Italy
Co-Authors: Sabrina Harmouch, Montreal, Canada, Marco Bandini, Milano, Italy, Felix Preisser, Hamburg, Germany, Sebastiano Nazzani, Milan, Italy, Zhe Tian, Helen D. Bondarenko, Montreal, Canada, Anil Kapoor, Hamilton, Canada, Luca Cindolo, Chieti, Italy, Alberto Briganti, Milano, Italy, Shahrokh F. Shariat, Vienna, Austria, Luigi Schips, Chieti, Italy, Pierre I. Karakiewicz, Montreal, Canada
Written by: Hanan Goldberg, MD, Urologic Oncology Fellow (SUO), University of Toronto, Princess Margaret Cancer Centre @GoldbergHanan at the 2018 AUA Annual Meeting - May 18 - 21, 2018 – San Francisco, CA USA