San Francisco, California (UroToday.com) Statistical issues are critical to designing and interpreting clinical research. In this session, Matthew Sydes, Professor of Clinical Trials and Methodology at the Medical Research Council Clinical Trials Unit, University College London, discussed the following statistical issue in clinical research:
- What is statistical significance?
- What is clinical relevance?
- Survival curves and censoring
- Testing and estimation
- Sample size calculations and impact on interpretation
He began the talk by dispelling the notion that a p-value < 0.05 is a magical threshold that determines the clinical relevance or importance of a study. Rather, he highlighted the definition of “p-value” and referred the audience to a published manuscript that outlines 25 ways that p-values are commonly misinterpreted.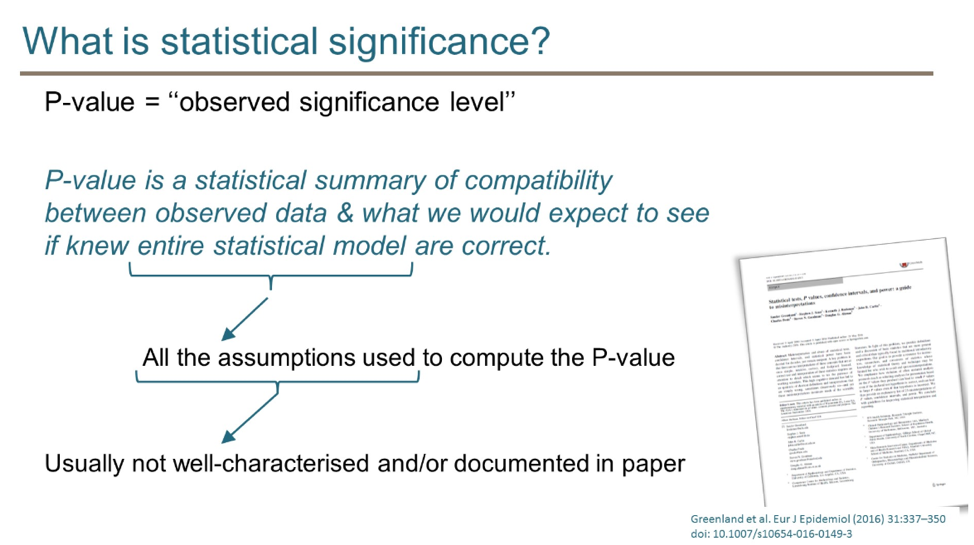

He then emphasized that there is too much focus on p-values in the medical literature and urged the audience to think about not only the statistical significance of a finding but also the clinical relevance. He then provided the following framework for thinking about study results:
The LATITUDE study of abiraterone in newly diagnosed metastatic hormone sensitive prostate cancer is an example of a study that was both statistically convincing (p=-value < 0.001) and clinically important (38% reduction in mortality compared to placebo).
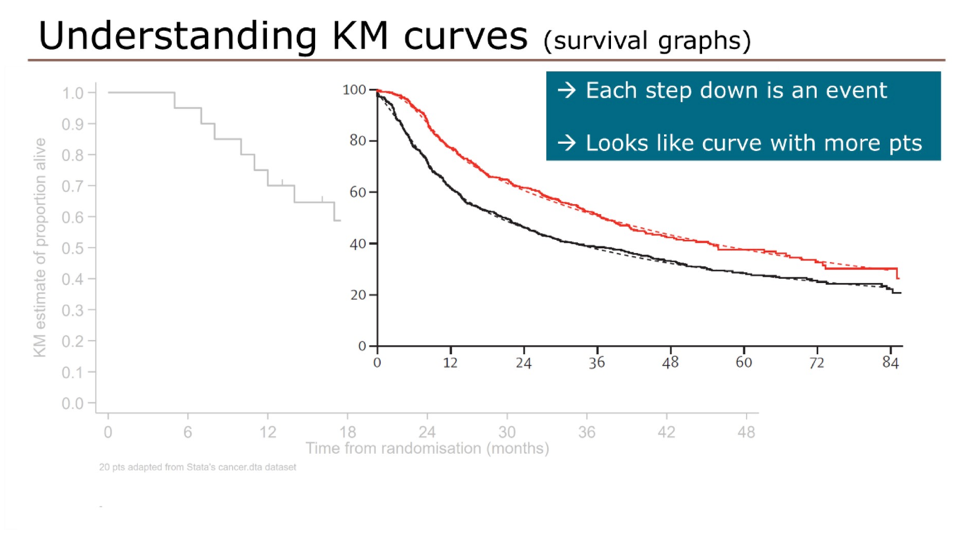
Switching to survival curves and censoring, he showed this graphic to demonstrate that Kaplan-Meier curves are a summation of events and censoring; each event (red squares) results in a drop of the Kaplan-Meier curve while censored patients (green dots) are denoted with a hashmark, but do not result in drops in the curve.
In large clinical trials with many patients and many events, the Kaplan-Meier starts to look more like a curve.
A limitation of Kaplan-Meier curves is that they often do not show the number of patients still at risk, the number of patients censored, and the number of events at various time points. The presenter urged the audience to use “extended risk tables”, which present this data at interval time points, allowing for a more accurate interpretation of Kaplan-Meier curves.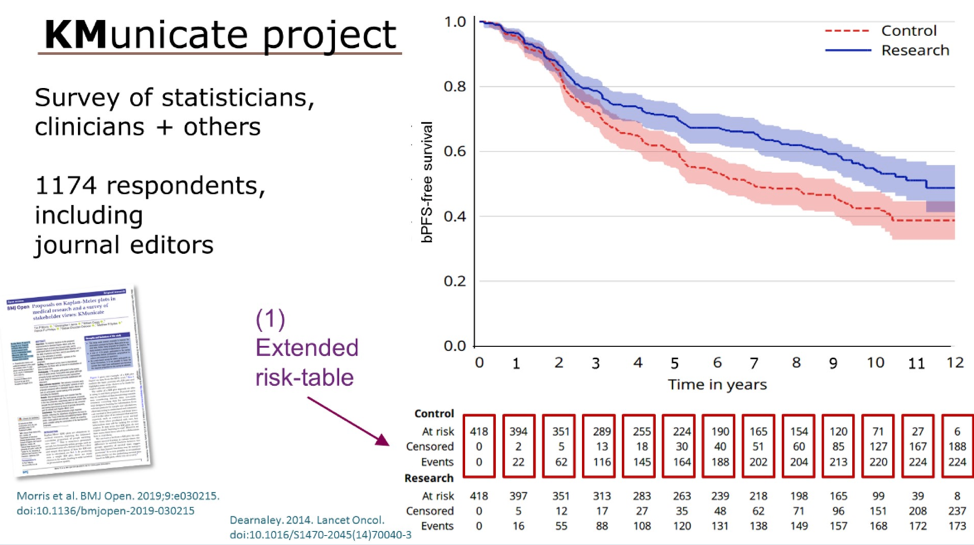
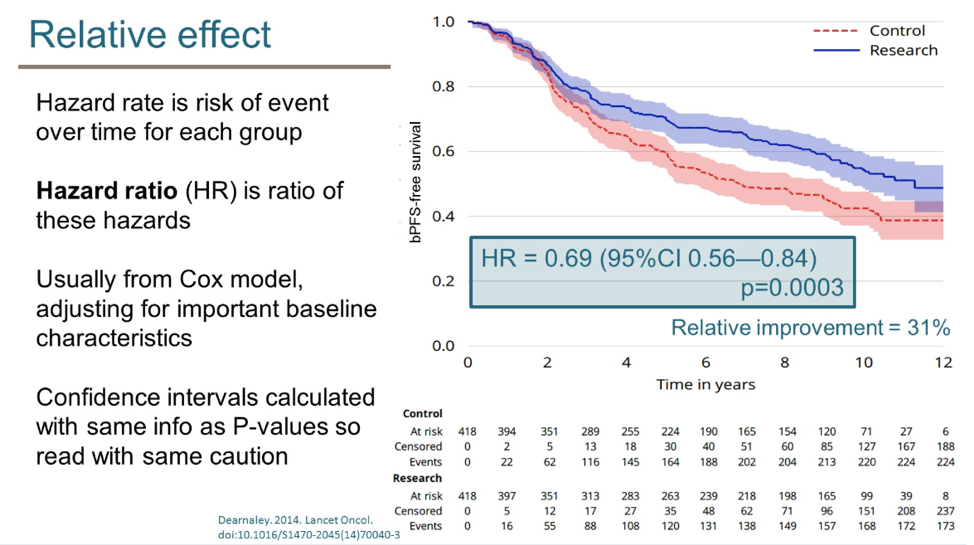
Kaplan-Meier curves are always accompanied by a p-value, but this statistical number can be derived in different ways: log-rank test and cox model. The slides below highlight the difference between these two statistical testing methods. He encourages the audience to indicate which test was used to generate reported p-values.
Moving on to a discussion of sample size calculations he reviewed the factors that are considered, including target effect size, alpha (false positive rate) and power (1 - false negative rate).
Using a practical example, he demonstrated that fewer events are required to detect a larger target effect size (below). In contrast, more events are required to detect a smaller target size.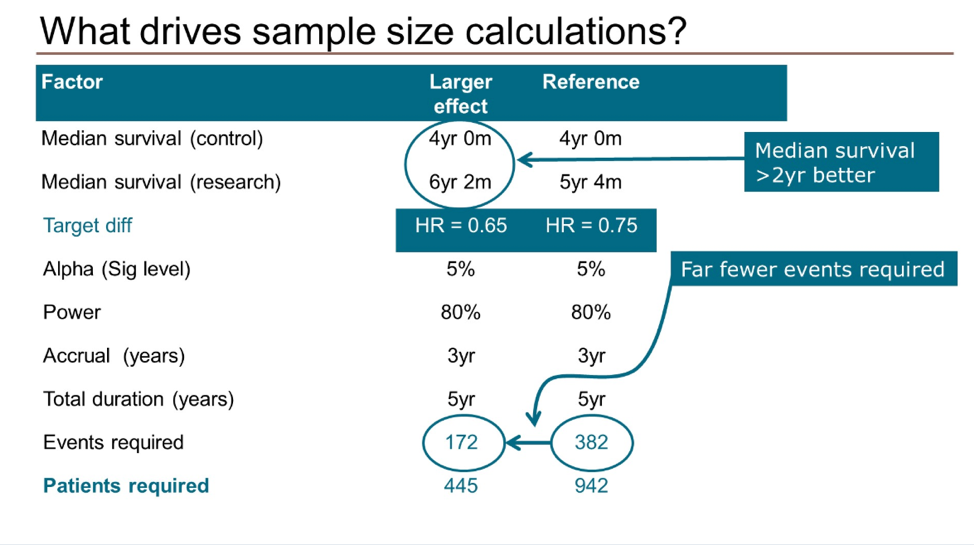
A limitation of Kaplan-Meier curves is that they often do not show the number of patients still at risk, the number of patients censored, and the number of events at various time points. The presenter urged the audience to use “extended risk tables”, which present this data at interval time points, allowing for a more accurate interpretation of Kaplan-Meier curves.
In conclusion, he provided a framework for assessing the statistical significance and clinical relevance of scientific studies and recommendations for language to use, and not use, when describing statistical findings.


Presented by: Matthew Sydes, MSc CStat CSci, MRC, Professor of Clinical Trials and Methodology at the Medical Research Council Clinical Trials Unit, University College London
Written by: Jacob Berchuck, MD, Medical Oncology Fellow at the Dana-Farber Cancer Institute (Twitter: @jberchuck) at the 2020 Genitourinary Cancers Symposium, ASCO GU #GU20, February 13-15, 2020, San Francisco, California