Therefore, we conducted a single-center, retrospective analysis of 92 patients with mCRPC who underwent [177Lu]Lu-PSMA RLT at our department. All patients had [68Ga]Ga-PSMA-11 PET/CT at baseline (≤ 6 weeks before the first RLT cycle) and at interim staging (6–8 weeks after the second RLT cycle), allowing for longitudinal BC assessment. BC analysis was performed using the 5-mm-thick contrast-enhanced CT images from the PET/CT scans.
In multivariable regression, relative change in VAT (HR: 0.26; p = 0.006), previous chemotherapy of any type (HR: 2.4; p = 0.003), the presence of liver metastases (HR: 2.4; p = 0.018), and a higher baseline De Ritis ratio (HR: 1.4; p < 0.001) remained independent predictors of OS. Patients with a greater decrease in VAT (< −20%) had a median OS of 10.2 months versus 18.5 months in patients with a smaller VAT decrease or VAT increase (≥ −20%) (log-rank test: p = 0.008). In a separate Cox model, the change in VAT predicted OS (p = 0.005) independent of the best PSA response after 1–2 RLT cycles (p = 0.09), and there was no interaction between the two (p = 0.09). Notably, baseline BC parameters showed no prognostic value.
PACS-integrated, AI-based BC monitoring detects relative changes in VAT, which was an independent predictor of shorter OS in our population of patients undergoing RLT. We hypothesize that this correlation could be explained by the development of tumor cachexia in these patients. Tumor cachexia is a condition characterized by a continuous decrease in skeletal muscle mass and adipose tissue and is often associated with poorer survival. These patients are also at higher risk of longer hospital stays and increased perioperative complications. However, it is currently not known whether VAT or prognosis can be positively influenced by supportive measures such as nutritional support in critically ill patients or high-calorie diets in patients at risk.
Monitoring changes in VAT should be carried out in clinical routine as patients undergo CT scans at regular intervals, and data on body composition can be extracted within seconds from routine staging CTs. Further prospective studies should investigate its independent prognostic value as well as the value of a high-calorie diet in patients at risk.
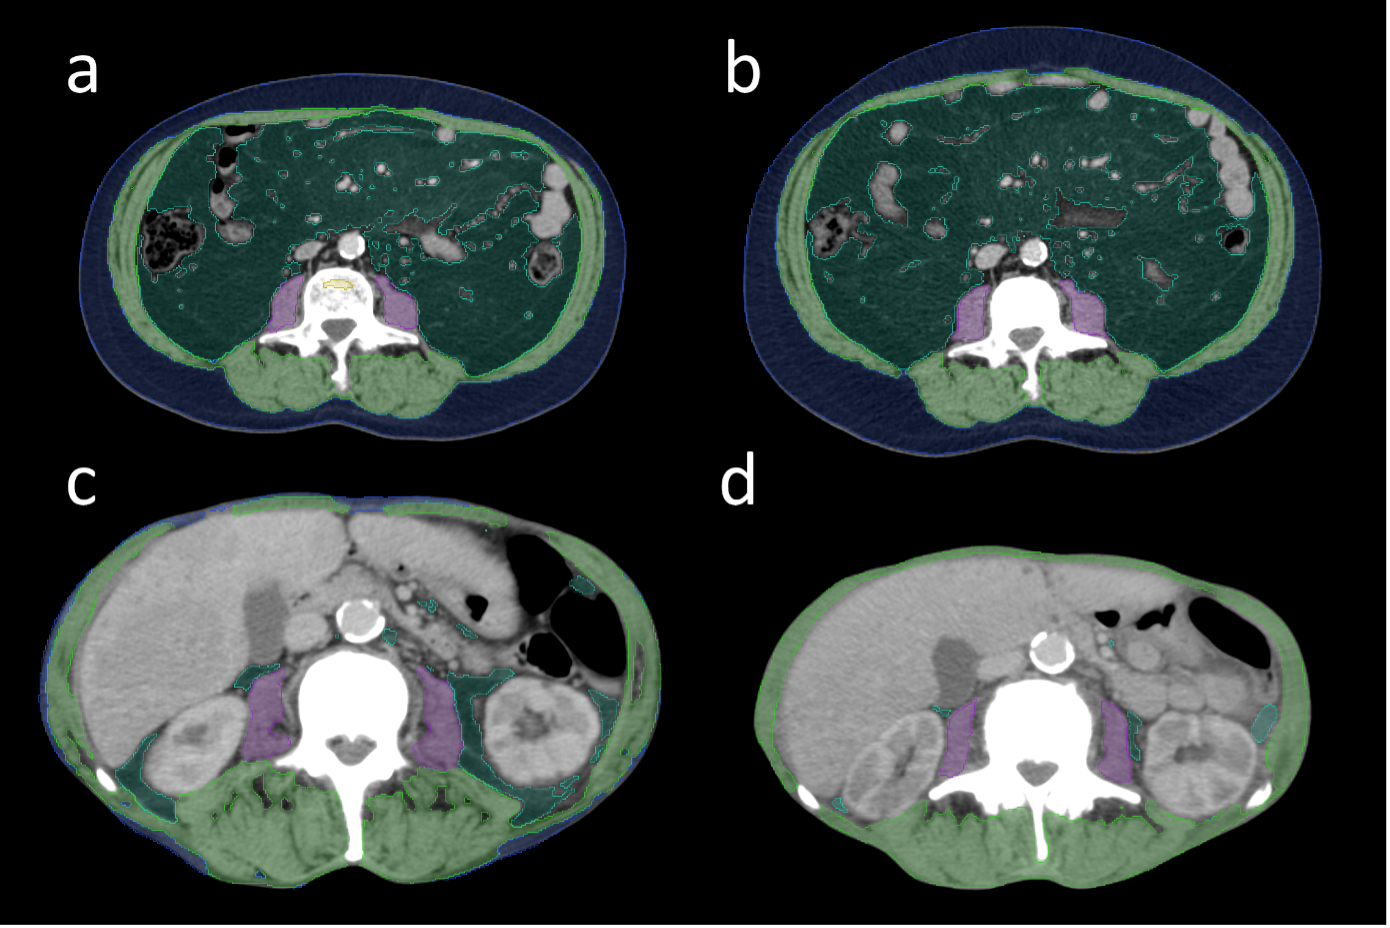
Figure: Representative patients illustrating visceral adipose tissue gain versus loss. Visceral adipose tissue (VAT) is highlighted in dark green. The figure shows two representative patients showing gain of VAT (a/b) and loss of VAT (c/d) between baseline PSMA-PET/CT before starting radioligand therapy (RLT) (a/c) and interim staging performed 6 to 8 weeks after the second cycle of RLT (b/d). The patient in the upper row remained alive for > 60 months before being lost to follow-up, whereas the patient in the lower row showed an overall survival of 7.3 months. Blue = subcutaneous adipose tissue; Light green = skeletal muscle; Purple = psoas muscle (Ruhwedel T et al., EJNMMI Research. 2025;15:112. DOI: 10.1186/s13550-025-01312-9).
Written by: Tristan Ruhwedel, Department of Nuclear Medicine, Charité - Universitätsmedizin Berlin, Corporate Member of Freie Universität Berlin and Humboldt-Universität zu Berlin, Berlin, Germany.
Read the Abstract