The peripheral zone of prostate has small and round or triangular acini, and the muscle bundles are multidirectional and loose. In contrast, in the central portion of the prostate (transition and central zones) the stroma is compact and has thick muscular bundles with less water content than the peripheral zone. Therefore, the mpMRI criteria for PC diagnosis are different in the transition zone than in the peripheral zone (Figure 1).
The different patterns of PC have variations in the size of the gland lumens and cell nuclei and correlate with Gleason patterns and prognosis. Grade group 1 prostate carcinomas (Gleason 3 + 3) are formed by glands similar to each other, with a regular stroma, that infiltrate between normal glands, so that the amount of water can be variable and sometime can be quite similar to normal tissue (Figure 2). However, tumors with a Gleason pattern 4 may have very different areas, characterized by tightly packed cells (fusion glands and poorly formed glands) with little intercellular water and therefore with little mobility of their molecules. Pattern 5 may demonstrate compact accumulations of neoplasic cells with little intercellular fluid, causing mpMRI to miss small tumors (less than 0.5 cm).
In tumors with predominant pattern 4, the percentage of detection varies according to the subtype of this pattern being from 36% for cribriform and more than 75% for the other subtypes, in such a way that the size visible for cribriform subtype must be bigger than 1.25 cm compared to other subtypes (0.75 cm to 0.95 cm) (Figure 3).
Because the mpMRI image is correlated to the cellular distribution and the mobility of the water molecules, certain non-neoplastic pathologies may demonstrate a similar mpMRI image to that of a tumor. This occurs when there is large accumulations of isolated cells in a liquid medium or with necrosis, as occurs in inflammatory processes or in cystic glandular atrophy.
In summary, there is a clear correlation with the mpMRI images and the morphologic attributes of the tumor.
Figure 1 – mpMRI T2 image (on right):
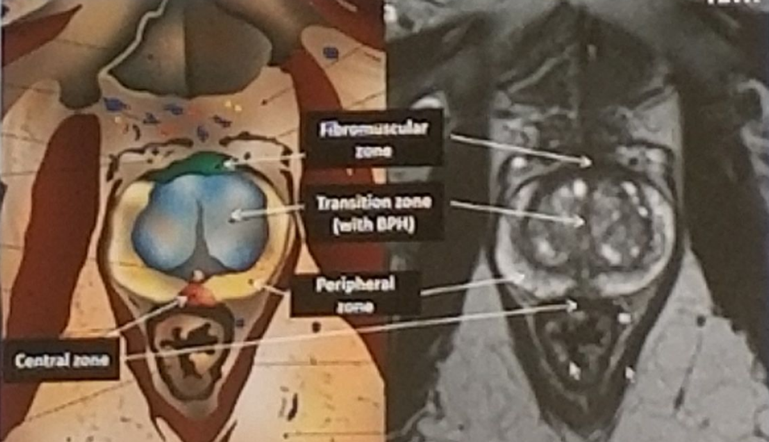
Figure 2 – Prostate cancer pathologic grade classification:

Figure 3 – Pattern 4 Prostate cancer:

Speaker: Ferran Algaba, MD, PhD Chief of the Pathology section in Fundació Puigvert- Barcelona-Spain, Associated Professor of Pathology, Medicine Faculty. Universitat Autónoma de Barcerlona, Spain
Written By: Hanan Goldberg, MD, Urologic Oncology Fellow (SUO), University of Toronto, Princess Margaret Cancer Centre @GoldbergHanan at The 15th Meeting of the EAU Section of Oncological Urology ESOU18 - January 26-28, 2018 - Amsterdam, The Netherlands